
Exploring 911 Emergency Calls: Insights and Analysis
In this blog post,we delve into the dynamics of 911 emergency and non-emergency calls to the police, aiming to unveil invaluable insights into call distribution, trends over time, and the critical prioritization of emergency response services.
This exploration is inspired by the critical nature of understanding community safety dynamics as well as emergency response systems. Analysing 9-1-1 call data presents a unique opportunity to have an idea of how frequent, what type, and where such occurrences are happening that help in making decisions on law enforcement and public safety.
The main purpose of our analysis in this study is therefore to dissect the dataset, distil meaningful full patterns and bring forward insights for improving emergency response strategies and allocating resources. Our focus will be on providing practical information that can inform decision-makers concerning addressing community security issues through comprehensive data analysis and visualization.
Firstly, our trip takes off by examining the attributes within the dataset and then using the Python pandas library for data loading and cleaning. To make sure that the data is clean, we applied imputation techniques for missing values. Then it employs different types of visualizations from various perspectives concerning the dataset.
Starting by using matplotlib, we see how calls are distributed across police districts and this gives us an idea of where emergency calls originate from. We will also concentrate on weekday emergencies to find out more about the temporal patterns in call volumes. Moreover, analysis of time series will enable us to detect notable trends or unusual behaviours in call frequencies.
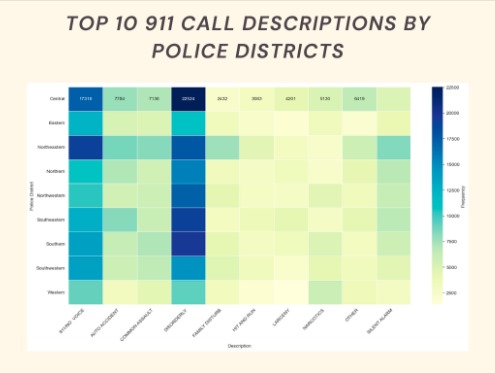
Moreover, word cloud visualization has been used to help readers see frequent themes contained in call descriptions thus providing some qualitative insights on reported incidents. The next analysis maps the top ten call descriptions spatially by Police Districts via heatmap through Seaborn thereby enhancing understanding of different area’s most common types of situations.
Finally, it seeks to examine changes in call priorities over time hence providing a window into the urgency, and severity of reported incidents as well as their implications for resource allocation and emergency response strategies.
Interpretation
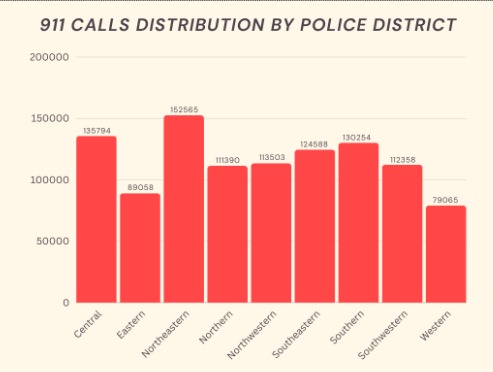
The chart depicts the distribution of 911 emergency calls across different police districts, showcasing significant variations in call volumes.
- The Northeastern district emerges with the highest number of calls i.e. 152,565, whereas the Western district reports the lowest call volume at 79,065 calls. Factors contributing to this disparity include population density, socioeconomic conditions, and crime rates.
- The Northeastern district likely experiences a higher demand for emergency services due to its larger population size, urban development, and potentially elevated crime rates.
- Conversely, the Western district may comprise areas with lower population density, suburban or rural landscapes, and comparatively lower crime rates, resulting in a lower demand for emergency services.
- These insights hold implications for resource allocation and emergency response strategies, enabling law enforcement agencies and emergency services to optimize resource distribution and personnel allocation.
- Areas with higher call volumes can be prioritized for proactive policing and emergency preparedness initiatives, ensuring efficient and effective emergency response across police districts.
Interpretation
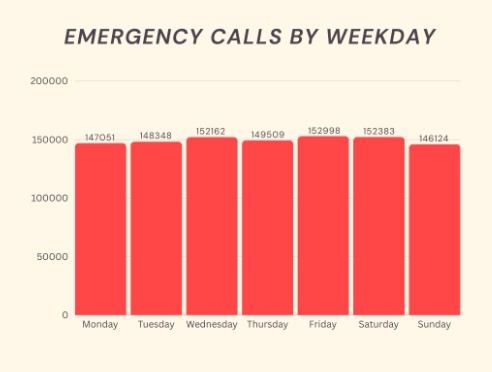
The given chart offers an insight into the distribution of emergency calls across weekdays indicating different patterns in call volumes throughout the week.
- Friday emerges as the busiest day for such calls by peaking at 152,998 calls and Sunday has the lowest volume with only 146,124 calls.
- There are several causes of fluctuation in call volumes including societal behaviour, work schedules and recreational activities among others.
- Usually on Fridays, there are a lot of social gatherings, and nightlife that is happening around town or maybe it could be another incidence that requires immediate aid as people relax from the busy week’s work.
- In contrast to this, Sundays often show a drop in emergency calls when individuals engage themselves in leisure activities as well as family time or maybe on other occasions religious observances may take place.
- Understanding these temporal patterns is important for allocating resources and planning for emergencies so that emergency response agencies can predict periods of high demand and allocate personnel and resources accordingly’’.
- Emergency services should plan strategically for high-demand periods such as Fridays to make sure they respond promptly and effectively to occurrences thereby enhancing overall safety and welfare.
Interpretation
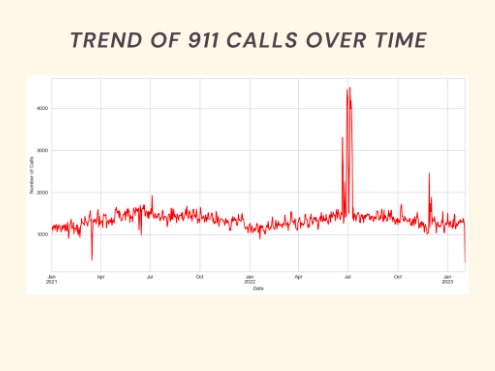
This line chart shows the number of 911 calls that were made over two years starting from January 2021 till February 2023. The y-axis indicates the number of calls while the x-axis shows the date in terms of month and year.
The following are some observations about the data:
- The number of 911 calls appears to have seasonal trends, with highs in summer (July-October) and lows in winter (January-April) for all three years.
- There seems to be a rising trend in call volumes from year to year. In January 2021, approximately one thousand calls were made, compared to an average of fifteen hundred calls in January 2023.
- However, it is worth noting that we cannot say whether this upward trend will continue throughout the year since only data for February 2023 is available.
Generally, this chart suggests that there may be a seasonal pattern linked to the number of 911 calls such that more are made during the summer months. Also, it is shown here that there has been an increase in the number of calls but additional information is necessary to confirm this observation.
Interpretation
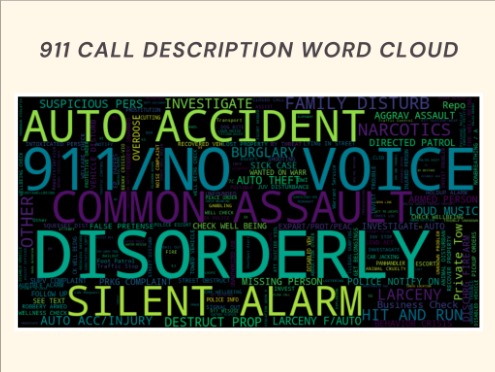
The word size reflects how frequently a word appears in 911 call descriptions.
- DISORDERLY
- 911 / NO VOICE
- AUTO ACCIDENT
- COMMON ASSAULT
- SILENT ALARM
- FAMILY DISTURB
- HIT AND RUN
- SUSPICIOUS PERS
- BURGLARY
- MISSING PERSON
- Public Disorder: There is a suggestion that calls on public disorder and conflicts constitute a large number of calls qualified as “disorderly,” “disturbance,” and “domestic disturbance.”
- Threats and Crimes: Calls pointing out potential crimes or safety threats are headlined by words like “Suspicious person,” “assault,” “hit and run” and ‘burglary’.
- Accidents and Medical Emergencies: Such calls as those labelled as “Auto accidents” or medically related ones, for example, the term “silent alarm” have been made due to accidents or potential medical situations.
- Welfare Checks: The name “Missing person” hints that it may be about missing persons who could be simply welfare checks.
- In general, the word cloud shows that 911 calls cover various issues with a focus on public safety concerns, criminal activities, and possible threats. Also, there are some indications of phone calls concerning accidents or medical emergencies; plus others about lost people.
Interpretation
The rows represent the different types of calls, and the columns represent the police districts. The colour intensity in each cell corresponds to the number of calls for that type of call in that district.
- Disorderly Calls: The frequent occurrence of disorderly calls appears to be the most common call type in all districts, followed very closely by “911/No Voice” calls.
- Central District: It has many calls in many categories such as Auto Accident and Disorderly.
- Eastern District: There are more “Common Assault” calls in the Eastern district than in any other district.
- Southern and Western Districts: These two generally have a lower number of calls compared with others.
Call Type Distribution:
- High frequency: Disorderly, 911/No Voice
- Average frequency: Larceny, Narcotics, Other, Family Disturbance
- Low frequency: Hit and Run, Auto Accident, Common Assault
Conclusion
To sum up our analysis of 911 emergency calls provides valuable insights into community safety dynamics and challenges faced by law enforcement agencies. Our analysis has set the stage for informed decision–making in emergency response systems by exposing trends in call distribution, temporal patterns, and prioritization of services. These insights will continue to guide improvements in emergency response strategies going forward.
I truly appreciate how this blog sheds light on vital social and political matters. You’re using your platform to make a difference, and you’re doing it exceptionally well.