
REAL ESTATE TRENDS-USA
We all have heard the term “Real Estate”, those who have not heard it will hear it in the future. Real Estate is a great investment. Most of the time it rewards the investor with the maximum return possible. It can be considered as one of the good ways to earn wealth. There are over 1.53 million realtors operating in the US as of February 2023. There are several companies which help the individuals to find the right property. Careers such as leasing agents, foreclosure specialists, title examiners, home inspectors, real estate appraisers, real estate agents, and mortgage brokers are found in the real estate industry.
Since real Estate is such a wide-range concept, one of the key factors is “property sales statistics” and we delved deeper into this factor by analysing the “Real Estate” dataset. We derived various insights through this dataset. The walkthrough involves steps like data cleaning; one of the essential steps to fetch accurate insights. There were not many outliers but the dataset contained a lot of missing values which could mislead the interpretations. To start with data cleaning, missing values were imputed with mode. Another big challenge was to convert the “List Year” column into the date-time column to plot a trend of property sales over the year. But it was achieved by specifying the “format” as “%Y”. The next step was to perform an Exploratory Data Analysis using the matplotlib and seaborn libraries.
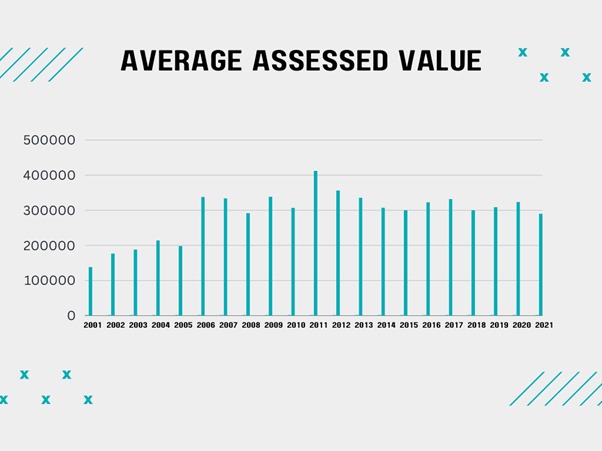
The bar chart shows the average assessed value of the property year-wise. There is a lot of variation in these values over the years. The maximum average assessed value can be noticed for the year 2011 which is equal to $412068. The assessed value is the dollar value assigned to a home or other property for tax purposes. In the earlier years, the average assessed value was lesser because the property taxes were less but as the time flew there was a gradual increase in the property taxes and the year 2011 noticed the highest property taxes. The year 2001 notices the minimum taxes on the property indicating the minimum average assessed value.
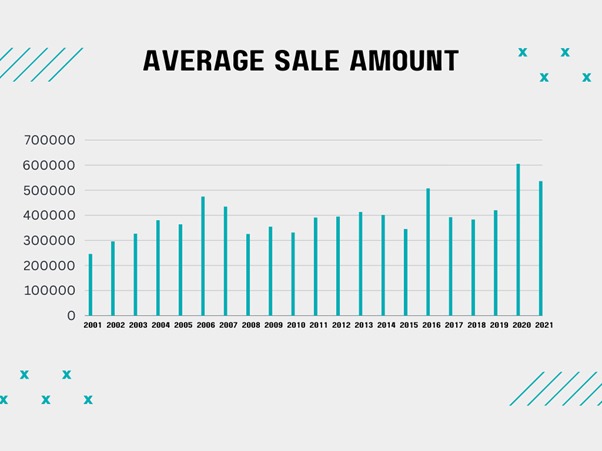
This bar chart represents the average sale amount of the properties. The year 2020 i.e. $604964 followed by the year 2016 i.e. $536975 noticed the highest sale amount on the properties. There is a possibility that the properties were in high demand in these years or maybe there was less inventory which led to an increase in the average sale amount of the properties during these years. Another important perspective is that there might be listings of highly-priced properties in these years, these can be considered as the extreme values that affected the mean and consequently, the average sale amount increased for these years.
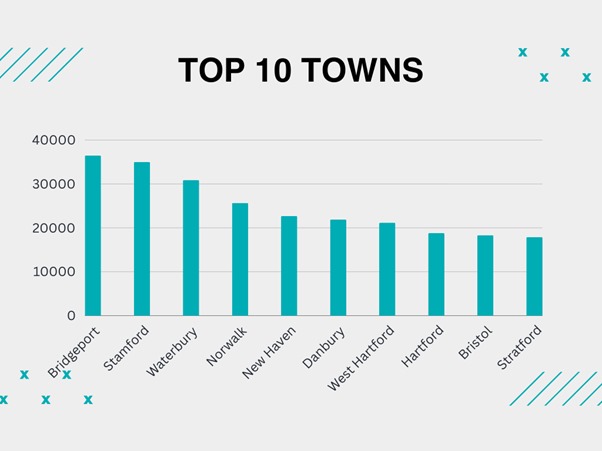
The above bar chart represents the top 10 towns in which the maximum properties were sold. The highest number was noticed in Bridgeport. It’s a populous city in the US. Bridgeport homeowners have the second biggest property burden of any city in the nation after Detroit, according to a study published by the Lincoln Institute of Land Policy.
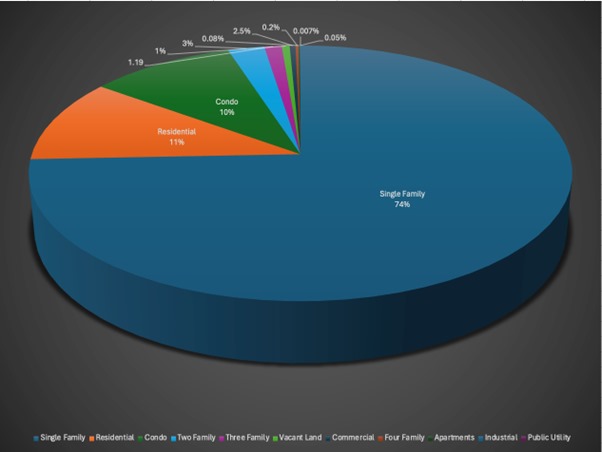
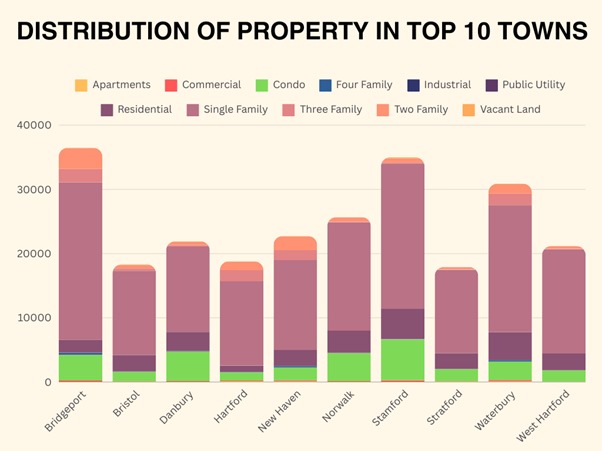
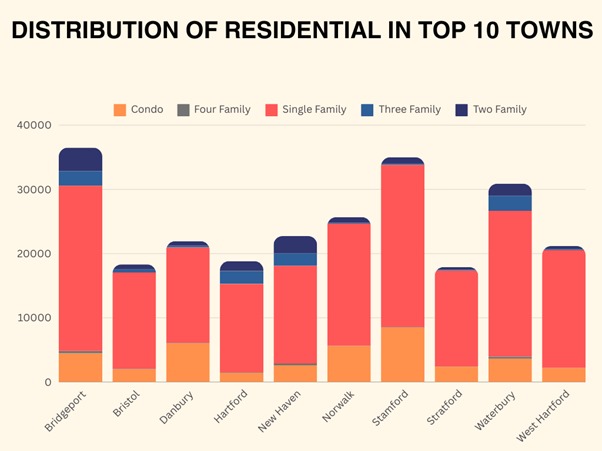
The above pie chart indicates the property type distribution. The maximum i.e. 74% is the “Single Family” property type. Followed by the “Residential” types. The other property types are comparatively very low. A house intended for one family to live at a single time is referred to as a “Single Family” type. The data reflects the actual scenario, at most the places, most of the properties have families that are “Single Family”. A condo is an individually owned residential unit in a building or complex comprised of other residential units.
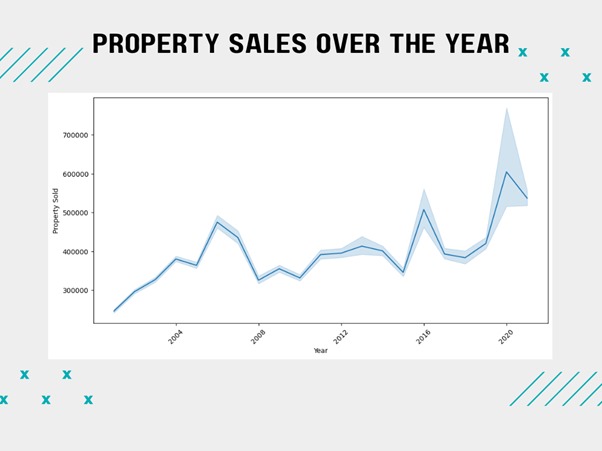
The above figure is a trend chart to observe the trend in the number of properties sold over the years. In the years 2001-2004, there were not many properties sold as there was not much demand in those years. There was an increase in demand for the properties for the span 2005-2007 but it was also not very much. During the years 2008 and 2015, there were variations in the number of properties sold. A gradual increase was observed in the year 2016 the sales dropped to some extent but again in 2020 there was a gradual increase. It will be interesting to note how the trend will behave in the upcoming years. The demand for the properties is increasing day by day as the population is increasing. An increase in population leads to an increase in all types of properties.
The conclusion can be derived that the maximum number of properties were sold at Bridgeport, so it will be beneficial to invest in a property at Bridgeport. It can be any type of property. The property can be easily sold whenever it is not required by the owner. Another important point is that the mostly properties are of the type of “Single-family”. It reflects that individuals prefer their privacy by not sharing the property with any other family. The assessed value indicates the taxes on the properties. The higher the property tax more is the assessed value. These insights will be very beneficial for the agents to get allocated the right properties on which they can earn a good profit. Moreover, owners planning to sell any property can study the trends and decide the appropriate selling price for their property and can earn a decent profit on the properties. The builders can design the buildings in such a way that the privacy of the family is at utmost priority. Following this approach will lead to the maximum sale of the properties and the families will also get satisfactory properties.
I admire how your blog focuses on impactful and thought-provoking issues. You’re making a real difference with your purposeful and insightful content.
“Hi! I recently came across your blog through Google and found it very informative. I hope you keep sharing such valuable content in the future, as it will help many readers. Best regards!”
I’ve been following this blog for years and it’s amazing to see how much it has grown and evolved Congratulations on all your success!
I love how this blog gives a voice to important social and political issues It’s important to use your platform for good, and you do that flawlessly
The level of my fascination with your work matches your own enthusiasm. Your sketch is elegant, and the authored material is impressive. Nevertheless, you appear concerned about the prospect of heading in a direction that could be seen as dubious. I agree that you’ll be able to address this concern promptly.